How to analyse customer feedback and open-ended survey responses with AI
Code customer comments by theme and sentiment, check each response and build a report using a worked example with 50 synthetic comments.
“The order arrived late, but the folders are sturdy.” A comment like this gives your delivery and product teams different information. Classifying it only as a negative review loses the praise for the product.
To analyse open-ended survey responses with AI, give every comment an ID, define the categories and ask for a table you can check against the original text. Count the themes after checking those classifications, then use the table to write the report. Our example uses 50 synthetic comments about a fictional office-supplies shop; none came from real customers.
Example files in Spanish:
- Source CSV: 50 synthetic comments
- Reviewed coding CSV
- Checked counts CSV
- Final PDF report (3 pages, Spanish)
What to keep in your feedback file
Keep a stable ID and the original text for every response, along with the survey question when there is one. You will need that context when a category assignment or a sentence in the summary looks doubtful.
Choose a question the analysis can answer: “Which parts of the buying experience do these comments mention?” Combining delivery reviews, employee survey responses and social-media comments in one count makes it harder to explain what the result describes.
The example CSV contains two columns, id and comentario, with IDs C001–C050. The comments are in Spanish; English excerpts in this article are translations for explanation, and the downloadable source keeps the original wording. The file includes praise, complaints, requests and replies with little information. Keep those last replies visible: “No comment” does not mean a neutral assessment of the service.
For a real export, remove personal information that the analysis does not need. Read the free-text column too: deleting a name field will not remove an address or identifying incident described in a comment. Decide which information your company permits you to send to the selected service before uploading the file.
How to keep themes and sentiment separate
A theme describes what a response discusses; sentiment describes the evaluation expressed in its wording. One comment can mention several themes and contain both praise and criticism, so store these decisions in separate fields.
SurveyMonkey's thematic-analysis export documentation makes the same field distinction: response ID, text, themes and optional sentiment remain separate. For this exercise, we define our own six-topic coding guide. The Spanish codes stay unchanged across the source file and its results:
| Code | Meaning | Boundary to keep |
|---|---|---|
entrega | Delivery timing, tracking, destination and choices | Shipping charges belong under precio |
producto | Product quality, condition, function and features | Merely naming a purchased item is insufficient |
soporte | Help, enquiries, exchanges and refunds | A website failure does not imply contact with support |
precio | Prices, discounts, charges and cost information | Late delivery belongs under entrega |
usabilidad | Finding, filtering, buying and managing orders online | The usability of the physical item belongs under producto |
embalaje | Boxes, protection, filling and packaging reuse | A product defect alone does not establish a packaging problem |
Use sin_tema when the text provides no identifiable topic. Report this status separately; it is not a seventh topic to add to the chart.
Our sentiment values are positive, negative, mixed, neutral and indeterminate. “I would like to choose the delivery day” is a neutral request under this guide. “I would not buy again” is negative with no identifiable topic. “Uh-huh” provides too little information and is indeterminate. The labels describe the text, rather than diagnosing a person's emotions.
Try the guide on varied comments before processing your own export. Add a rule when a case exposes an unclear boundary, and revisit affected rows whenever a definition changes. Keep the version of the guide used for each analysis.
What to ask the AI to produce
Ask for one output row per input comment, including all applicable themes, one sentiment label and a verbatim supporting extract. Get that table before relying on a summary, so you can see which responses support each category.
Upload the CSV and provide the coding guide in the same conversation. Adapt the guide to your research question; this prompt shows the output and checking requirements:
1Analyse the attached CSV using the coding guide provided.
2Preserve every ID and original comment. Do not omit or duplicate
3rows. All 50 responses in this exercise are synthetic.
4
5Create a downloadable CSV with these columns:
6id, comentario, temas, sentimiento, evidencia, nota_revision.
7
8Apply every explicitly relevant theme. Separate multiple codes
9with semicolons; never repeat a code within one row. Use sin_tema
10alone when no topic is identifiable. Keep the guide's Spanish codes.
11Assign exactly one overall sentiment: positivo, negativo, mixto,
12neutro or indeterminado, following the guide's definitions.
13Do not infer a person's emotional state.
14
15Copy supporting evidence verbatim from the Spanish comment and
16record interpretative doubts. Check that input and output IDs match.
17Count comments mentioning each theme, at most once per theme per
18comment, and use 50 as the denominator. Report sin_tema separately;
19the sentiment counts must total 50. Do not claim these results
20represent real customers or a wider population.
Save the actual prompt and selected model name with the result. If you try another model or change a definition, retain the earlier output so a reviewer can follow the change. Keeping individual cases accessible is also a feature of Rädiker and Kuckartz's procedure for analysing open-ended questions.
How to check the coding and reconcile the totals
Read each output row against its original comment and the coding guide, then recalculate from the corrected labels. Theme counts can add up to more than the number of responses because a single response can discuss several topics.
For this exercise, use all 50 comments as the denominator, including those without an identifiable topic. Divide the number of comments mentioning a theme by 50 and multiply by 100. Dividing by the number of assigned labels would answer a different question.
We ran the exercise in Ilisai's test environment with Auto selected. The first output preserved all 50 IDs and comments, but put every sentiment into neutral or indeterminate, missed themes and displayed a chart that disagreed with its CSV. Those totals needed review before anyone could use them.
A separate AI agent checked all 50 rows against the source and guide. The review changed theme assignments in 30 rows and sentiment labels in 44, and replaced all 50 evidence fields: they had lost the original capitalisation and often cut off the relevant clause. We then supplied explicit corrections, requested new files and checked the files obtained. No human validation took place.
| ID | First output | Corrected and checked output |
|---|---|---|
| C013 | No theme, indeterminate | entrega;producto, mixed |
| C015 | embalaje, neutral | producto;embalaje, negative |
| C025 | usabilidad, neutral | precio, positive |
| C039 | No theme, indeterminate | No theme, positive |
C013 needs both the late delivery and the sturdy folders. C015 mentions a torn box and a damaged stapler without establishing that one caused the other. C025 praises the clarity of the cost but does not mention a website interface. C039 says “Everything was perfect”: a positive evaluation with no identifiable topic. These explanations translate the Spanish source.
The final CSV also keeps five interpretation notes. C027, for example, combines punctual delivery with a conditional preference for a smaller, cheaper box. Under our guide it is positive because the request does not assert an existing problem. A different guide could resolve that ambiguity differently, so the decision remains documented.
The final files were checked for all 50 unique IDs, complete source texts, labels and verbatim evidence. No row combines sin_tema with a topic. This records the correction of one synthetic exercise; it does not estimate general model accuracy or remove the need for review.
What the 50 comments show after review
Delivery and product each appear in 13 comments, or 26% of this synthetic set. The six topics have 63 assignments and their percentages total 126%, because a response can discuss several topics.
| Theme | Comments | Percentage of 50 |
|---|---|---|
| Delivery | 13 | 26% |
| Product | 13 | 26% |
| Support | 8 | 16% |
| Price | 10 | 20% |
| Website usability | 10 | 20% |
| Packaging | 9 | 18% |
The five comments without an identifiable theme, or 10%, are reported separately and do not form a seventh bar. The checked chart uses these six counts and a zero baseline; its labels are in Spanish.
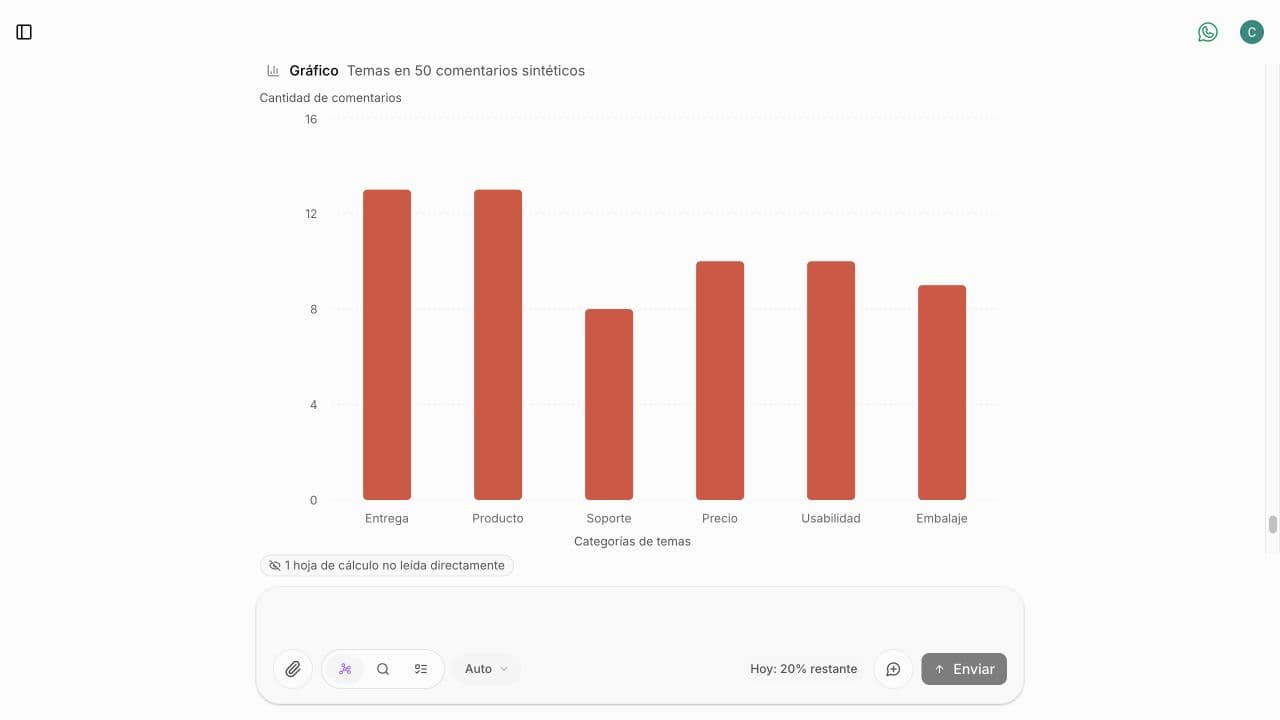
Screenshot of the checked chart in Ilisai. A comment can have several themes: 63 assignments across 50 synthetic comments, with the five no-topic comments reported separately. Chart labels are in Spanish.
Sentiment assigns exactly one value to each comment:
| Sentiment | Comments | Percentage of 50 |
|---|---|---|
| Positive | 16 | 32% |
| Negative | 17 | 34% |
| Mixed | 7 | 14% |
| Neutral | 8 | 16% |
| Indeterminate | 2 | 4% |
| Total | 50 | 100% |
The final report is a three-page PDF in Spanish. It contains both tables, three observations linked to IDs and two proposed next steps, generated from the corrected classifications and editorial instructions. The report and chart agree with the reviewed CSV; their figures describe only these fictional comments.
How to turn the chart into a useful report
Use a bar chart to compare how many comments mention each theme, and include examples with their IDs. Frequency helps you choose what to investigate; it does not establish severity, satisfaction or business priority on its own.
A delivery bar can contain praise for prompt arrivals, complaints about delays and requests for a choice of date. Read the relevant comments before recommending a delivery improvement. A serious product defect mentioned once may still deserve attention.
After checking the rows, request the report:
1Use only the reviewed coding CSV. Recalculate the counts and
2create a bar chart of themes with a zero baseline. The unit is
3“number of comments”. State that the 50 comments are synthetic
4and that each comment may have several themes. Report no-topic
5responses and sentiment separately.
6
7Create a downloadable PDF report with the coding method, counts,
8three observations supported by response IDs and two proposed
9follow-up investigations. Separate observation from interpretation.
10Do not infer causation or representativeness. Do not invent human
11validation, sales improvements or time savings.
For a real comparison over time, keep the survey question, selection method and coding guide consistent, or explain what changed. You also need to know who could respond and who did. This synthetic dataset cannot estimate customer opinion or establish how much material your team can reliably process in one session.
In the enterprise
Assign ownership of the coding guide, disputed cases and final report. If several countries or departments contribute, preserve the original language and document translations; a common category list still needs careful interpretation in each language. For continuous analysis connected to your CRM, access permissions and case tracking, assess survey or customer-experience software designed for that operation.
Trying the workflow in Ilisai
Ilisai can work with CSV or XLSX input, show a chart in the conversation and generate downloadable files for review outside the chat. You can choose from the available models and continue working towards the report, while the person responsible for the analysis checks its labels and conclusions.
Start with the synthetic CSV, then use an export your company has authorised for this purpose. Our guide to AI for data analysis covers the wider spreadsheet workflow, and the AI document generator explains document outputs. Check pricing for allowances and usage details.