AI for business intelligence and data analysis: from spreadsheet to insight
Analyze a spreadsheet with AI, check the calculations and produce a chart and downloadable report. A worked Eurostat example, with clear limits on when you need BI.
The monthly sales file is ready. The question for Monday's meeting is why margin fell, and whether the change is concentrated in a few products. AI can group the rows, calculate differences and draft an explanation. You still need to check which rows it used and what it means by margin.
In 2025, 20% of EU enterprises with at least ten people employed used an AI technology, according to Eurostat's enterprise survey. That measures adoption within the survey's business sectors. It does not establish whether any particular analysis is accurate or useful.
For a first spreadsheet task, ask for an answer you can verify, a chart you can inspect and a file someone else can open.
What AI adds to business data analysis
AI data analysis lets you request calculations, comparisons and explanations in ordinary language. You define the business question and check that the result uses the right data and definitions.
A sales export might contain dates, products, quantities, revenue and cost. You can ask for margin by product without writing every formula yourself. But you must specify whether revenue includes tax, how returns are treated and which costs belong in the margin calculation. Correct arithmetic cannot fix the wrong definition.
Business intelligence, or BI, provides the regular reporting around a business: shared measures, reports and dashboards. AI can also sit inside that environment. Microsoft, for example, documents natural-language questions over prepared Power BI data models. The conversational interface still depends on preparation.
AI data analysis for a small business can start with an exported spreadsheet and a specific question. The resulting report describes that export. Transactions entered afterwards will be missing until you provide updated data.
Prepare the spreadsheet before you upload it
Use a table with clear column names, one record per row and consistent units. Add the definitions that affect the calculation, including dates, tax, returns and the measure you want to compare.
Keep the original file and prepare a separate copy for analysis. Microsoft's guidance for analyzing Excel tables also recommends unique column headings and avoiding merged cells; both are useful preparation for this exercise.
| Check | What could go wrong | What to settle |
|---|---|---|
| The meaning of a row | One order spans several product lines | Whether to count lines, distinct orders or customers |
| Dates | A complete month is compared with twelve days | Which periods are comparable |
| Values and units | Euros and thousands of euros share a column | One unit for each column |
| Missing values | Some products have no recorded cost | Flag, exclude or obtain the missing value; do not assume zero |
| Duplicates | Two rows have the same order number | Whether they are duplicates or legitimate order lines |
| Permitted information | Phone numbers appear in a sales export | Which fields are authorized and necessary for the analysis |
Ask for a row count and a list of missing values and suspected duplicates before requesting conclusions. A flagged record is a question for review. Two invoices for the same amount may both be valid.
Worked example: compare six countries using a Eurostat CSV
Eurostat's public enterprise data provides a small example in which you can check every value against its source. The exercise uses twelve aggregate observations from six countries, with no customer records or claimed Ilisai business outcomes.
The figures come from Figure 2 in Eurostat's workbook on enterprise AI use, using its December 2025 extraction. They measure the percentage of enterprises using at least one surveyed AI technology, among businesses with ten or more employees and self-employed people in the covered sectors.
The question is: how did the share of enterprises using AI change in these six countries between 2024 and 2025? These countries form a selected example, not an estimate for the whole EU.
1. Establish what is in the file
Download the twelve-row CSV and attach it in an ilisai chat.
The CSV has four columns: country code, country, year and percentage of enterprises using AI. There should be one row per country and year, no missing values and percentages between zero and one hundred.
The survey covers manufacturing, construction and many services, but excludes some economic activities and businesses with fewer than ten people employed. Eurostat's methodological article sets out the full scope.
2. Ask for a comparison that leaves a calculation trail
This shortened English prompt captures the instructions used for the exercise:
1Compare 2024 and 2025 in this CSV. First check the twelve rows,
2six countries, duplicate records and missing values.
3
4Calculate 2025 minus 2024 in percentage points. Show a table and
5a grouped bar chart with both years, a zero baseline and the unit
6“% of enterprises”. Sort countries by their 2025 values.
7
8Create a downloadable XLSX with the original data, calculations
9and a short note preserving the source, population and limitations.
10Separate observations from hypotheses. Do not invent causes or
11forecasts, or calculate an EU average from these six countries.
3. Check the arithmetic before interpreting the chart
Subtract the 2024 percentage from the 2025 percentage. For Spain, 20.27 − 11.31 = 8.96 percentage points; describing that as “8.96% growth” would mean something different.
| Country | 2024 | 2025 | Change |
|---|---|---|---|
| Denmark | 27.58% | 42.03% | +14.45 points |
| Finland | 24.37% | 37.82% | +13.45 points |
| Sweden | 25.09% | 35.04% | +9.95 points |
| Germany | 19.75% | 25.97% | +6.22 points |
| Spain | 11.31% | 20.27% | +8.96 points |
| France | 9.91% | 18.16% | +8.25 points |
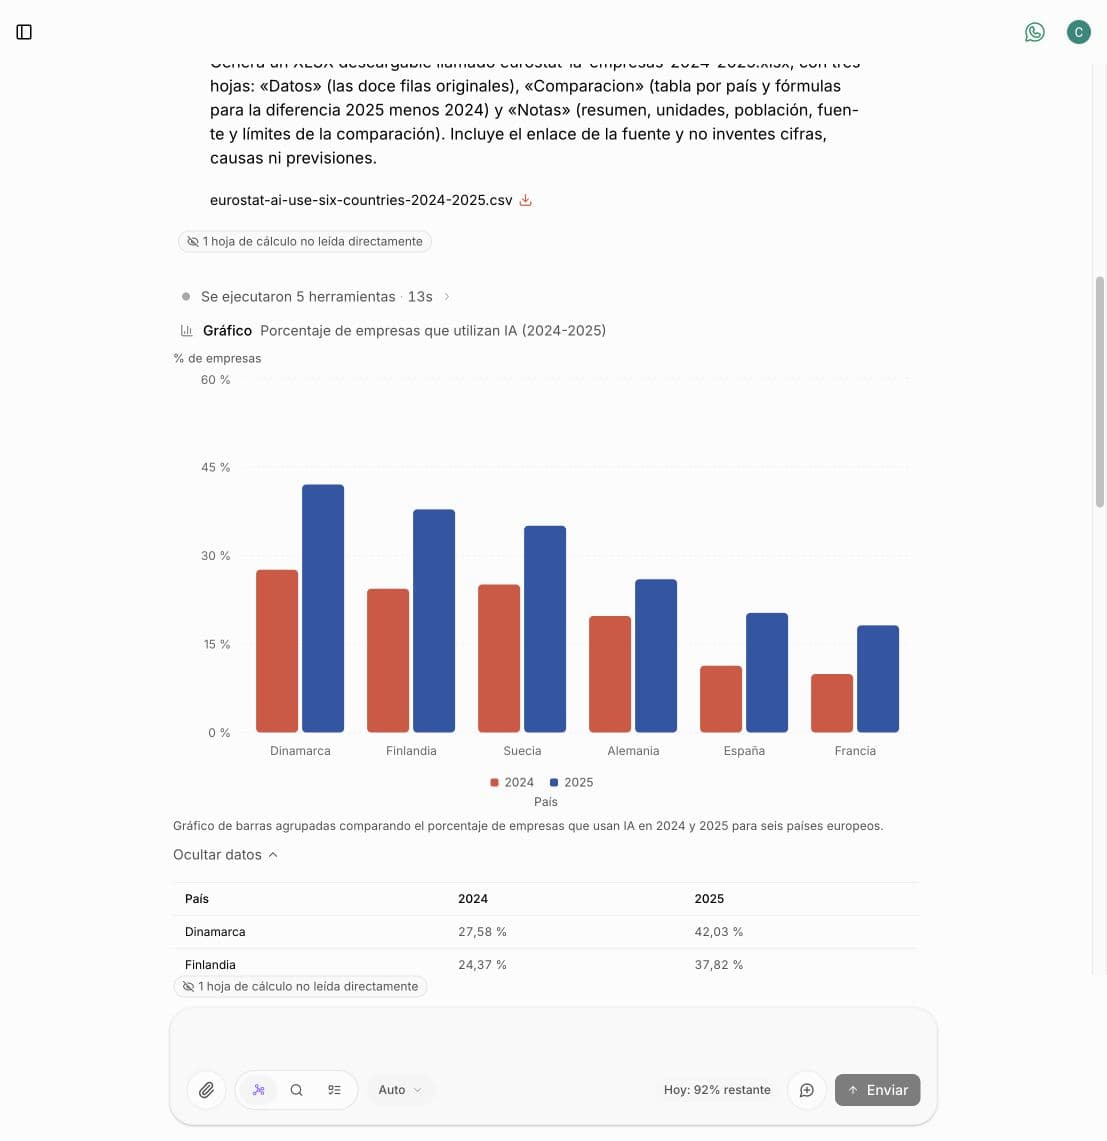
Static screenshot from the Spanish-language demonstration in ilisai's QA environment.
All six countries recorded an increase. Denmark had the highest 2025 share and the largest percentage-point increase within this selection. Those observations do not explain what caused the changes.
Eurostat added image, video and audio generation to the 2025 questionnaire. This comparison does not separate the effect of that addition. It also cannot measure productivity, profitability or generative AI use alone.
4. Keep the output and its context together
The output workbook should retain the original rows, the change calculations and notes on the source and population. Open the XLSX and inspect its values; a readable chart does not establish that the downloadable file contains the right calculations.
In our first output, the differences were stored as fixed numbers and the country-code column was missing. We requested formulas and all four original columns, then checked both in the corrected workbook. We also requested wider columns and wrapped notes so all three sheets were readable.
Download the checked XLSX with Spanish notes. It includes the original data, six difference formulas, and notes preserving the source, population and limitations.
Spreadsheet tasks you can repeat in your business
An export can support questions about sales, customers and operations when it contains the relevant fields. The following are possible applications to validate with your own data, not measured results from the Eurostat exercise.
| Application | A useful request | What a person should check |
|---|---|---|
| Natural-language querying | “Which products have the highest return rate?” | Comparable rates and the treatment of partial orders |
| Narratives and summaries | “Draft the monthly meeting note from these changes” | Every statement against a value; provide a fresh export for the next report |
| Drivers of a change | “Break down the revenue movement by product and region” | Each group's numerical contribution; an association does not prove a cause |
| Customer and revenue analysis | “Group customers by purchase frequency and spend” | Consistent identifiers, returns and permitted data |
| Operations and supply chains | “Compare promised and actual delivery dates by supplier” | Open orders, working calendars and agreed changes to deadlines |
You can also ask the AI to flag unusual amounts within the file and show the underlying rows. That prepares a review of the export. To notify someone when the next order arrives, you need a connected system and a monitoring rule.
In ilisai, you can upload a CSV or XLSX, request an analysis and obtain an interactive chart in the chat and a downloadable file. The AI document generator shows the available outputs: Excel, Word, PDF and PowerPoint. Download documents to open them in your usual application, and check both the chart and the file.
When you need a BI platform
You need a BI platform when reports must refresh from business systems, enforce access for different users or send alerts without someone uploading another file. Operational forecasting also needs enough historical data, validation and ongoing checks of prediction error.
| Requirement | Why a conversation with an export is insufficient |
|---|---|
| Role-specific views | Sales and finance may need different measures and permissions that the organization maintains |
| Continuous anomaly detection and alerting | A system must evaluate new data and someone must receive and handle alerts |
| Demand, revenue or capacity forecasting | Predictions need comparison with actual results and a method that someone reviews when it fails |
| Connected recurring reports | Connections, refreshes and failed data loads need an owner |
These capabilities need configuration. For example, Power BI documents both scheduled refresh and permissions that restrict which rows a report viewer can access. Check that a proposed system covers your requirements and that someone will maintain the rules.
Ilisai does not provide live BI connectors, role-based dashboards or autonomous alerts. It can help you explore an authorized export and prepare a report. Use your BI platform or a dedicated analytics system for continuous monitoring.
In the enterprise: definitions, access and approval
Enterprise analysis needs an owner for each measure, appropriate data access and a person who approves the result's use. The spreadsheet, chart and written explanation must use the same definition.
Finance might define net revenue as sales excluding tax and after returns, while sales works with orders that have not yet been invoiced. Agree which measure answers the meeting's question before comparing the reports. Keep that definition with the file.
The data owner should decide which export may leave the source system and who may receive the report. Removing names does not necessarily make a file anonymous: other fields may identify a person. A file can also reveal commercial information. Review the service terms and your organization's rules for the data involved.
The reviewer needs enough information to reconstruct totals, find exclusions and distinguish an observation from a recommendation. A purchasing or staffing proposal warrants closer review than a chart for an exploratory meeting.
Decide whether the first analysis is worth repeating
Start with a question your team already answers and compare the complete job: preparation, analysis, checking and corrections. Repeat the process when the result supports the decision and the review effort is worthwhile.
Keep the input file, instructions and approved report. Record time spent, calculation corrections and missing information. If column names or margin definitions change every month, resolve that before trying to automate the routine.
The Free plan offers a limited allowance for getting started; consult plans and usage conditions to assess the cost of your analyses. For other tasks your team could try, read the guide to generative AI for business.
Frequently asked questions
These are the practical questions that come up when moving from spreadsheets to AI-assisted analysis.
Do I need to code to analyze a spreadsheet with AI?
For this workflow in ilisai, you can upload a CSV or XLSX and describe the job in ordinary language. You need to understand the columns and check the results, even though you do not write code.
Will AI replace data analysts?
It can perform parts of data exploration and report preparation. Defining measures, investigating causes, validating forecasts and judging data suitability still requires expertise, including specialist help where the task warrants it.
Can I analyze customer data?
Only when the service and the information you intend to share are authorized for that purpose. Limit the export to necessary fields and check who will receive both the data and the report.
Will the chart update when my spreadsheet changes?
The analysis describes the file you provided. You must supply updated data to incorporate changes; if you need automatic refresh, look for that capability in a BI platform.
Start using AI today
Create your free account and access multiple AI models from a single interface.